BandRider
End-to-end live show management for artists, venues, and production teams
Sole product designer · Research, product strategy, UX, UI · Direct collaboration with client across multiple workflow sessions
TL;DR
A production manager was spending his mornings finding information rather than using it. Every document — riders, stage plots, day sheets, crew assignments — was being recreated from scratch for every show and immediately orphaned from everything else. The core insight: the industry runs on documents, it should run on data. Designed an end-to-end show management system that treats artist and venue information as structured records rather than static PDFs. The client's home venue has formally backed the project. Two strategic partners are in active conversations.

Background
What it actually takes to run a live show. For each show: a technical rider specifying every piece of equipment the artist needs, a stage plot, an input list for sound, a day sheet, hospitality requirements, crew assignments, settlement paperwork.
That's one show. The client managed multiple venues simultaneously. He was experienced, organized, and still spending most of his morning just finding information rather than using it.

Discovery
I spent time inside the actual problem before designing anything. The client walked me through his real workflow over multiple sessions. He shared his inbox, pulled up live documents, showed me how a day sheet got created and distributed. I went in expecting a tool problem.
What I found was an information architecture problem. The tools weren't broken. Email works. PDFs work. Spreadsheets work. The problem was structural — every piece of information that needed to move between people was getting created from scratch each time, sent as an attachment, and immediately orphaned from everything else.
Three things I noticed in the inbox session:
The context-setting problem. A huge proportion of emails were just re-establishing shared ground. Here's the rider, here's the updated day sheet, here's who the crew lead is. Information that shouldn't need to be re-sent if both parties could access the same source.
The version problem. "Is this the latest stage plot?" came up multiple times during the session. Nobody could confirm the document they had was current. Decisions were being made on stale information.
The assembly lag. A show booked six weeks out would still have its documents assembled in the 48 hours before. No way to capture information progressively — riders and stage plots got created from scratch every time because there was no persistent record to build from.

The core insight
The industry runs on documents. It should run on data. A rider is a static PDF. It gets emailed, saved, printed, re-emailed. When anything changes, someone creates a new one and sends it again. The old version doesn't go away — it sits in inboxes, indistinguishable from the new one without reading both carefully.
The reframe: A rider isn't a document. It's structured data about an artist that stays mostly constant and only changes at known moments. If you treat it as data, one update propagates everywhere and the PDF is just something the system generates.

Early structure
First attempts at making the insight real. The core insight pointed to a structural direction but not a specific interface. Two initial concepts explored how to organise a show workspace and how artist and venue information should be stored. Both were wrong in ways that led directly to the decisions that shaped the final product.

First attempt at a show workspace, documents uploaded and tracked per show. Solved the location problem but not the version problem or the assembly lag. Stage plot v1 sitting next to v2 with no way to know which was current. Every show still assembled from scratch.

Early IA exploration: what if artist and venue information lived in persistent profiles rather than per-show documents? Each field tagged with what it was replacing in the existing workflow. This structural question became the foundation for the profiles decision.
Key decisions
Riders as living profiles. The existing workflow treats every document as a fresh creation. A rider gets written, sent, and immediately orphaned from the next show.
✕ Document-based — Familiar, low friction. Preserves the exact problem we were hired to solve.
✕ Fully structured data entry — Every rider field becomes a form field. Too much migration friction. PMs would maintain their PDFs in parallel and use BandRider as a secondary system.
✓ Structured profiles that generate documents — Artist profile holds band members, crew, stage plot, input list. Venue profile holds specs and contacts. Records update once and reflect everywhere. When a new show gets created the system pre-populates from these profiles. The PM confirms what changed rather than recreating from scratch.

Band members, key contacts, and crew in one place. Information that previously lived across separate emails and rider PDFs, now part of a single persistent record everyone on the show can access.

The stage plot and input list lives in the profile, not in an attachment. Updated once, visible immediately to everyone who needs it. No version question, no re-send.

Everything a touring crew needs to know about a venue before load-in. Accessible directly through the profile — no emails, no asking around. Any updates are immediate and visible to everyone.
Where everything comes together. Creating a show pulls from both profiles automatically. The artist's stage plot, input list, and tech requirements pre-populate from their profile. The venue's specs and contacts are already there. What's left is the show-specific information — dates, lineup, settlement terms, box office — and the process of advancing it with every party involved.
The tab system represents the full advance process. Each tab is a domain that has to be completed before the show happens. The green checkmark answers "is this done?" without opening a single email.

Multi-party activity log: input list added by one person, crew sheet updated by another. The advance is happening across the team and the record shows it in real time.

Stage plot tab: Stage plot embedded in the show record — pulled from the artist profile, updated once, accessible to everyone. No email needed to confirm it's current.

Settlement tab: Full financial breakdown in one record — gross revenue, expenses, artist payouts, venue split. Previously tracked across spreadsheets and disputed because nobody had the same version.
Mobile: Scoped for show day reality
Mobile scoped to show day, not full feature parity.
✕ Full desktop feature set on mobile — More capability equals more useful. On show day people are moving. A mobile app trying to do everything would be worse at the one thing that mattered most.
✓ Scoped to show day execution — Four documents a stage manager checks five times on show day: day sheet, stage plot, input list, tech specs. Everything else lives on desktop. A more limited mobile app is actually more useful on show day.
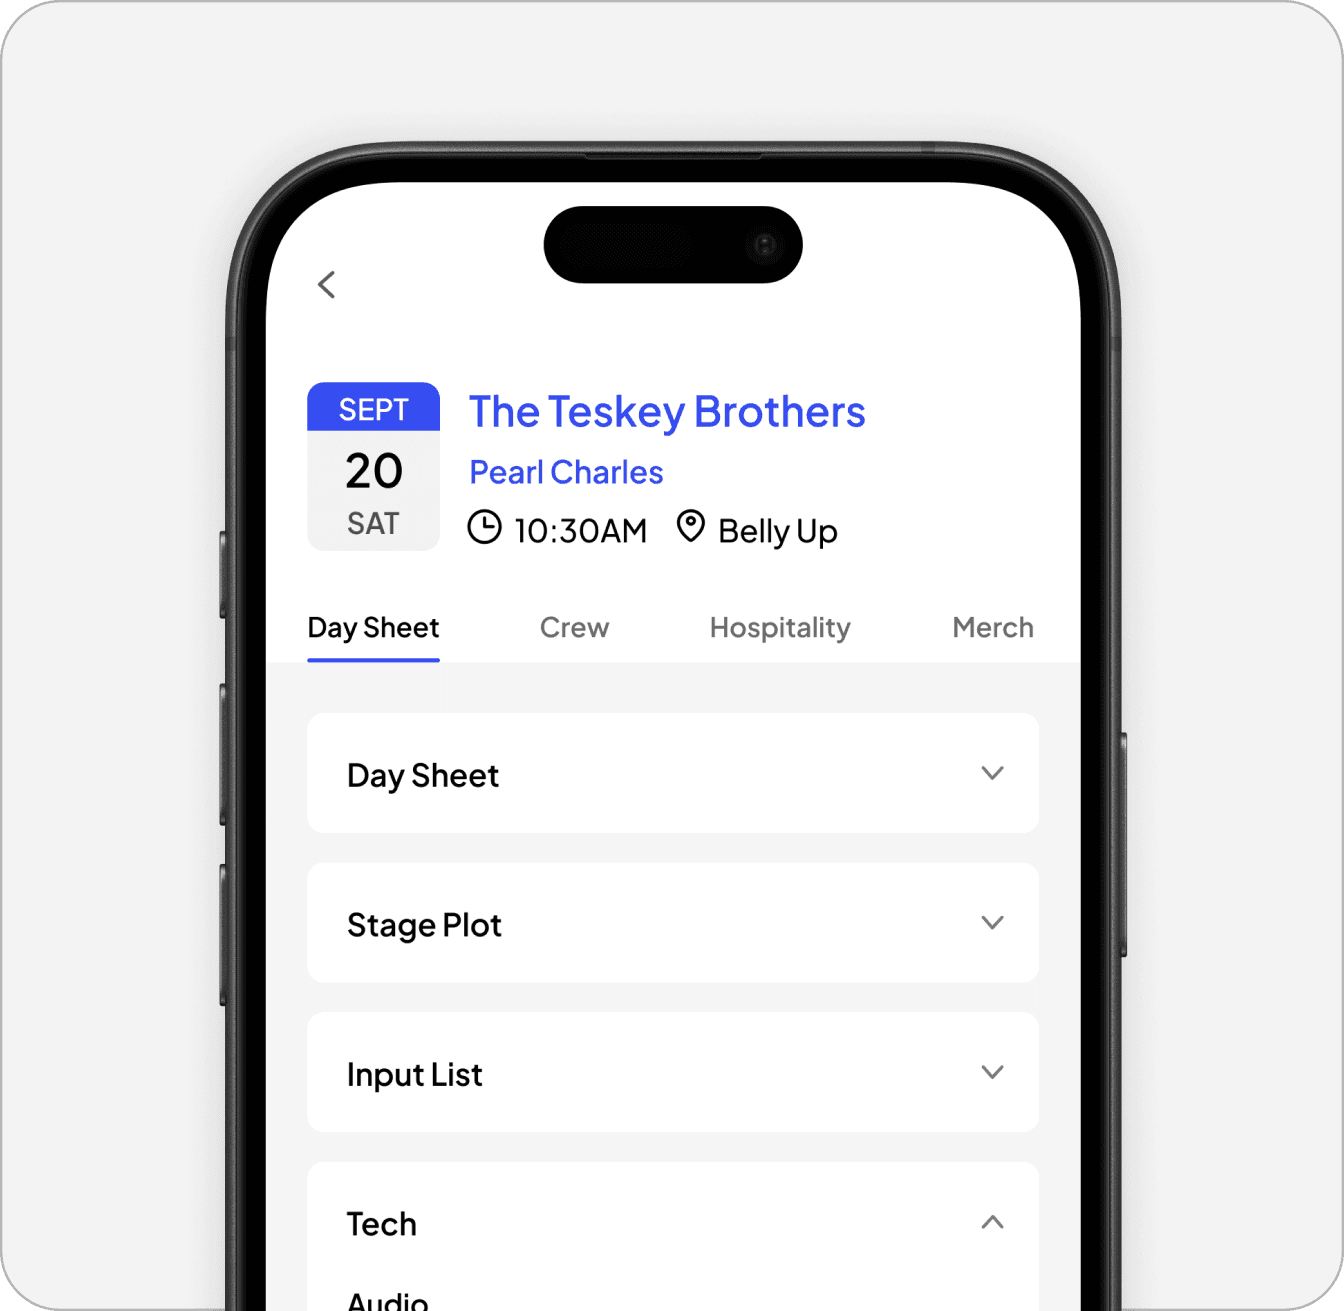
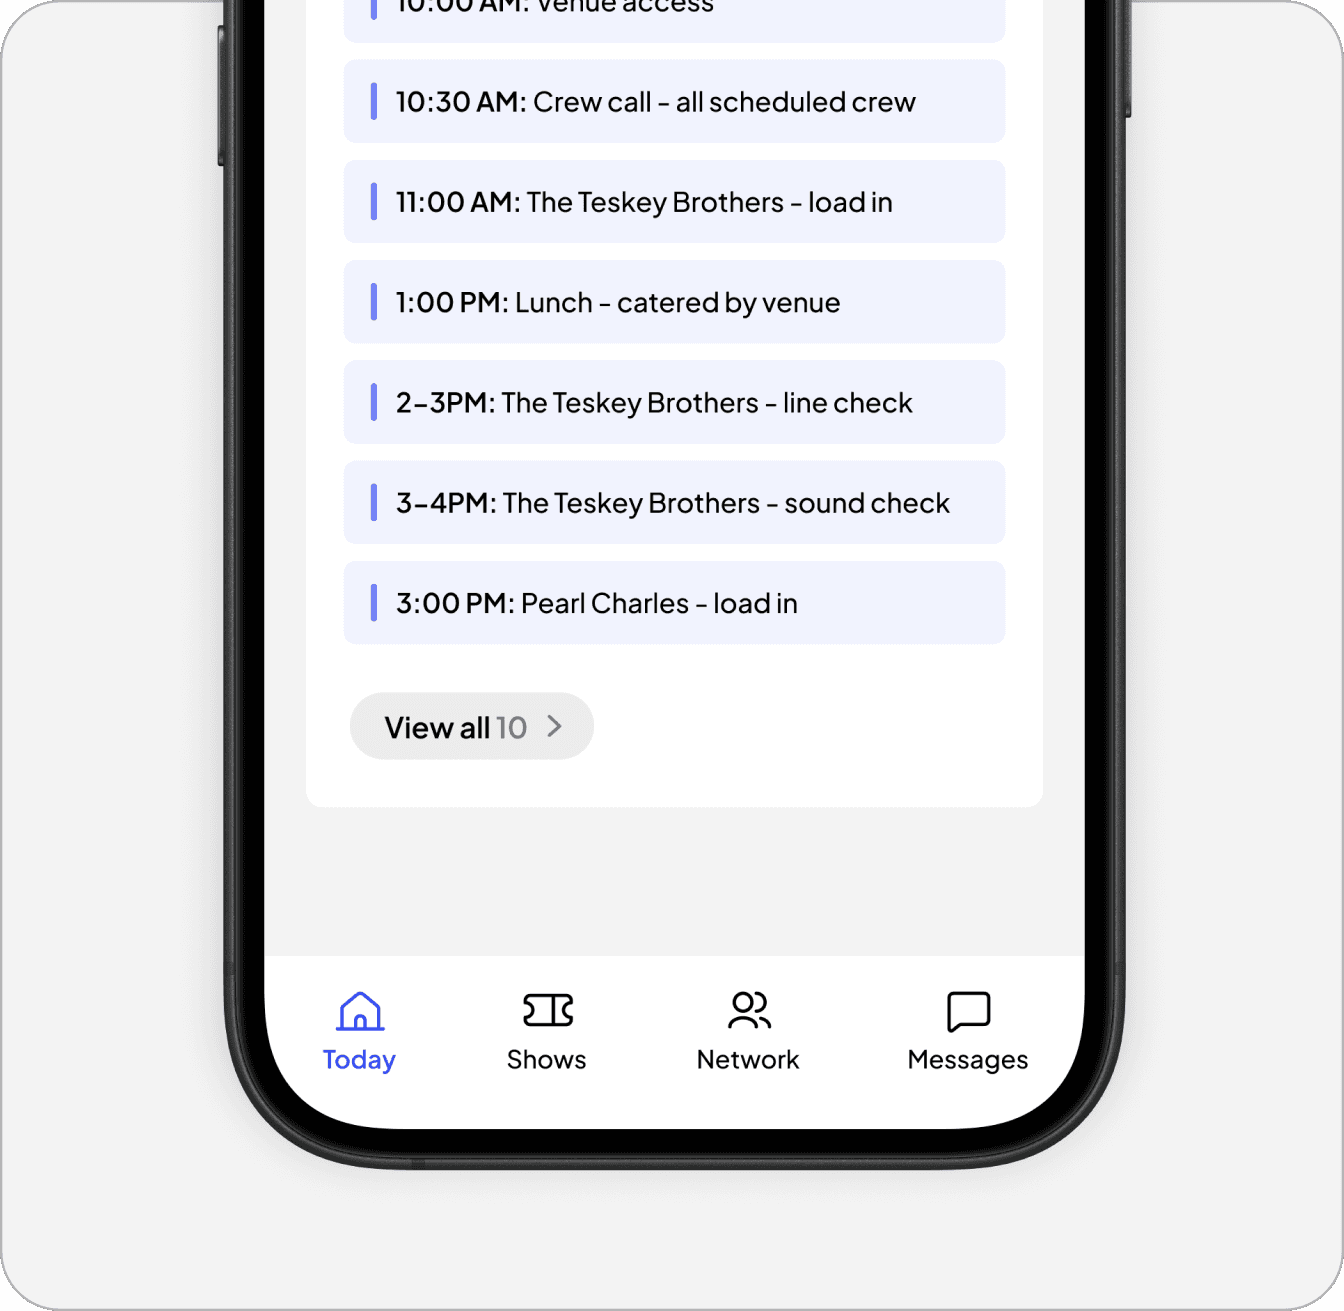
The constraint was the feature. A more limited mobile app is more useful on show day than a comprehensive one.
Gaining real traction. BandRider hasn't launched publicly but it's past the prototype stage in terms of what it's doing in the world. The client's home venue has formally backed the project. Two strategic partners are in active conversations, both introduced through
prototype walkthroughs.
"I've shown this to people who've been in live music for twenty years and they immediately get what it fixes.
That's exactly what I was hoping for." — Client
The research sessions were the most valuable part of this project and I didn't do enough of them. I had access to one PM's workflow. Live music production varies a lot by venue size and touring scale. Some of my assumptions about how touring crews interact with the system are based on inference, not observation.
I'd also map the alert logic earlier. BandRider's value depends entirely on the right person knowing the moment something changes — a day sheet updated the night before a show, a crew member who hasn't confirmed by noon. I designed what those notifications look like. I didn't design what fires them, who sets the rules, or how a PM overrides the defaults. That's a product decision that would land on the designer in a real build and I left it unresolved.